
Customer experience
Why ISPs Should Segment NPS by Region and Service Type
Segmenting NPS by geography and service type reveals hidden insights. Learn how Sonar DataConnect helps ISPs turn raw scores into actionable strategies.
Madeline Hanna, Customer Marketing Manager
May 14, 2025 · 5 MIN · UPD JUN 16, 2026
ISPs should segment by region and service type because a single blended score hides where Detractors, churn, and loyalty actually live. Breaking down by geography and connection type turns a vague number into a map of which subscribers to fix and where to grow.
In the broadband industry, Net Promoter Scores (NPS) are rarely pretty - but that doesn’t mean they’re not powerful. What matters most is how you interpret and apply them.
If you're an Internet Service Provider (ISP) measuring NPS without segmenting by geography or service type, you may be making decisions based on misleading insights. Let’s explore why context is critical - and how Sonar DataConnect can help you automatically uncover what’s really going on beneath the surface.
Why NPS Still Matters in a Low-Scoring Broadband Industry
The broadband sector is known for having some of the lowest NPS scores across all industries - often dipping well below zero. According to Satmetrix benchmarks, telco and cable providers frequently trail sectors like financial services, hospitality, and software.
There are several reasons for this:
Customer expectations for internet access are sky-high - there’s zero tolerance for downtime.
Installation complexity, service interruptions, and billing confusion are common friction points.
In regions with limited ISP competition, customers may feel stuck, increasing dissatisfaction.
In other words, a score of - 15 might seem like a red flag in another industry. But in telecom? That could be a top-tier result.
The Math Behind NPS, and Why Detractors Matter Most
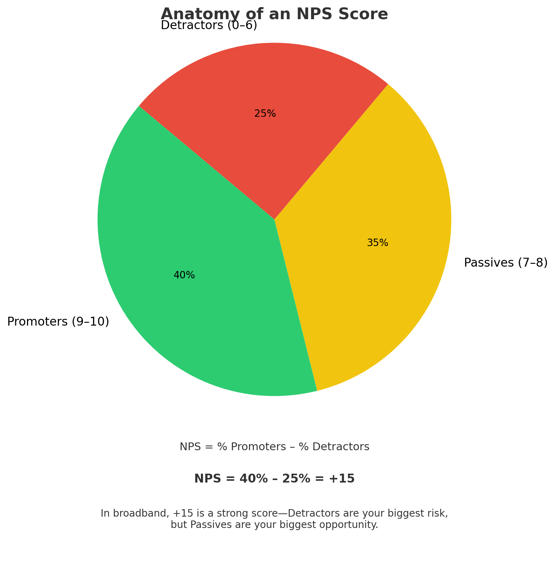
Quick refresher: NPS measures customer loyalty with one question - “How likely are you to recommend our service?” Responses are categorized as:
Promoters (9 - 10): Loyal advocates
Passives (7 - 8): Satisfied but quiet
Detractors (0 - 6): Unhappy and vocal
The NPS is calculated as:
Promoters (%) - Detractors (%) = Final NPS
So:
40% Promoters - 25% Detractors = +15
Flip those numbers, and you're at - 15
But here’s the critical part: Detractors don’t just lower your score - they actively harm your business.
They leave negative reviews, flood support, and vent on social media.
In rural markets, one vocal Detractor can impact dozens of potential customers.
Often, they churn quietly, leaving you without feedback.
It takes four Promoters to outweigh the damage caused by a single Detractor - a tough ratio in any market. In broadband, where every subscriber counts, ignoring Detractor patterns is a direct threat to retention and reputation.
The Key to Smart NPS Use: Segmentation
To avoid misreading your score - and to pinpoint where Detractors are coming from - you have to ask:Which customers gave us this score, and why?
That’s where segmentation becomes essential.
Segment #1: By Population Density (Urban vs. Rural)
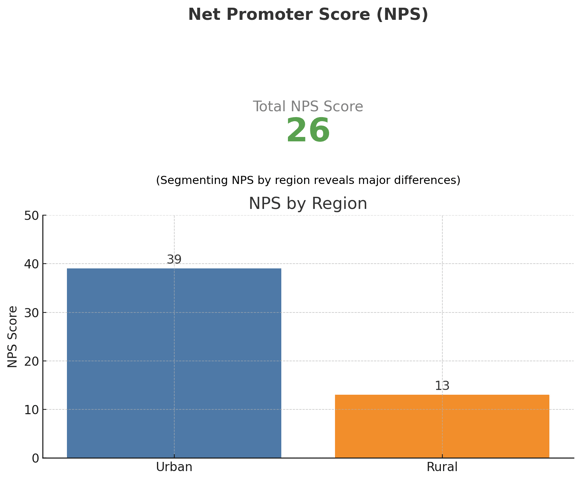
If you serve both urban and rural markets, relying on a single NPS score across your entire customer base can be misleading. It may hide regional differences in customer satisfaction - and obscure issues (or wins) tied to specific service areas or subscriber types.
Take Starlink as an example. In urban markets, it’s not a major threat to fiber providers. But in rural areas, it’s a different story - Starlink consistently reports high NPS scores. Why?
Self-install kits make it easy to deploy in areas far from tech support
Lower expectations in underserved regions mean even modest performance can exceed customer standards
If you're seeing strong NPS in metro regions but weaker results rurally, segmentation can reveal where you're losing ground to unexpected competitors. More importantly, it helps you uncover the "why" - so you can fix what’s holding satisfaction back and improve loyalty where it counts.
Segment #2: By Connection Type (Fiber vs. Fixed Wireless)
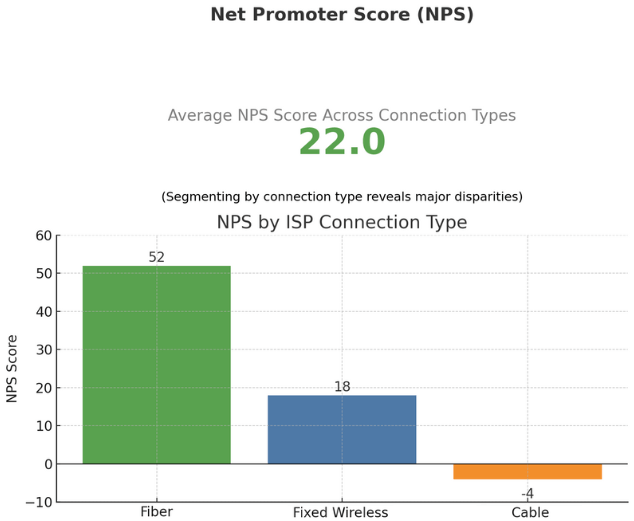
Are you blending your NPS across fiber and wireless subscribers? You could be missing critical insights.
Combining Net Promoter Scores from fiber and fixed wireless can blur meaningful trends. Fiber typically drives higher satisfaction thanks to its speed and reliability - so if your fiber NPS is falling short, that’s a red flag. It could mean you’re underdelivering on the service that should be your top performer.
Meanwhile, a low wireless NPS can highlight where to take action. For example, you might:
Expand fiber in high-opportunity areas
Improve wireless onboarding or billing clarity
Strengthen support to offset occasional reliability gaps
Segmenting your NPS by connection type gives you a clearer picture of performance, helps you focus improvement efforts, and enables you to balance short-term fixes with long-term growth.
More Ways to Segment: Rep, Channel, and Ticket Type
Beyond connection type and geography, there’s real value in segmenting NPS by service rep, support channel, or ticket category. For example, tracking NPS by service rep can highlight top performers and uncover coaching opportunities. Segmenting by support channel (chat, phone, email) reveals how customer sentiment shifts based on communication preferences. And when you map NPS to common ticket types - like billing, installation, or outages - you gain a clearer picture of which customer journeys need the most attention. These internal benchmarks can be just as powerful as external comparisons when it comes to improving satisfaction from the inside out.
From Confusion to Clarity with Sonar DataConnect
Tracking NPS is simple. Understanding it is the hard part.
Sonar DataConnect bridges that gap by transforming raw survey responses into segmented, actionable dashboards.
With DataConnect, you can:
Break down NPS by region, population density, or technician territory
Filter by connection type, hardware, or installation method
Identify Detractor clusters early - before they churn or post reviews
Cross-reference NPS with KPIs like install wait times, ticket volume, or support CSAT
No more spreadsheet chaos. Just real-time insight.
Unlock NPS & Other Insights with DataConnect
Make NPS Your Competitive Advantage
Used wisely, NPS is more than just a metric - it’s your early warning system and growth accelerator.
It can reveal:
Where customers are happiest
Where your operations are struggling
Where silent churn is eating into your margins
But only if you measure it intelligently.
With tools like Sonar DataConnect, you can segment, automate, and act - turning static NPS scores into strategic decisions.

Frequently asked questions
What is a good NPS score for an ISP?
Broadband has some of the lowest NPS scores of any industry, often dipping below zero. Because of those benchmarks, a score like - 15 that would alarm another sector can be a top-tier result in telecom - context matters more than the raw number.
Why do Detractors matter more than Promoters in broadband?
Detractors leave negative reviews, flood support, and often churn quietly without feedback. It takes four Promoters to outweigh the damage caused by a single Detractor, so spotting Detractor patterns early is critical to retention and reputation.
Why segment ISP NPS by fiber versus fixed wireless?
Fiber typically drives higher satisfaction than fixed wireless, so blending the two can hide a falling fiber score or mask where wireless onboarding, billing, and support need work. Segmenting by connection type shows where to fix issues and where to expand.
Questions, answered.
Why should ISPs segment NPS by region and service type?
Segmenting NPS by geography and service type reveals regional and product-level loyalty signals that a single blended score hides. Breaking the score apart lets ISPs see where satisfaction is strong and where it is slipping.
What is a good NPS score for broadband and telecom providers?
Broadband has some of the lowest NPS scores of any industry, so a score that looks weak in other sectors can still be strong here. A score of -15 can be a top-tier telecom result.
How is Net Promoter Score calculated and why do Detractors matter most?
NPS is calculated as the percentage of Promoters minus the percentage of Detractors. Detractors carry heavy weight because it takes four Promoters to outweigh the damage of one Detractor.
How does segmenting NPS by fiber versus fixed wireless reveal hidden insights?
Blending fiber and fixed wireless NPS blurs trends, since fiber typically drives higher satisfaction than wireless. Splitting the score by connection type surfaces product-level differences that a combined number conceals.
See it on the platform
20 minutes wired to your operation.
An ISP-only specialist walks Sonar through your specific use case. No generic deck, no horizontal SaaS pitch.
Book a meetingWritten by
Madeline HannaMarketing, Sonar
Madeline Hanna is Customer Marketing Manager at Sonar Software, writing about customer experience, retention, and broadband funding for ISP operators.
All posts by Madeline Hanna