
Product
Sonar Status Page: Real-Time Uptime, Incidents, and Alerts for ISPs
Sonar's status page provides updates and notifications for uptime stats, details on system metrics, interruptions, and more.
May 10, 2022 · 4 MIN · UPD JUN 16, 2026
The Sonar status page, available at status.sonar.software, is a one-stop view of Sonar's real-time uptime and downtime, system metrics, and ongoing and past incidents. ISP operators use it to confirm at a glance whether a problem is on Sonar's side or local to their network.
At Sonar, we created software with the intention of improving the operational efficiency of your Internet Service Provider business. With so many features available within a single window, it's no surprise that your instance is heavily depended upon to continue the day to day functions. So, when things cease to load or sync, it's imperative that you understand what the root cause is. With this in mind, we've created the Sonar Status Page, a one-stop shop that relays real-time information on Sonar's uptime/downtime, system metrics, along with access to ongoing and past incidents.
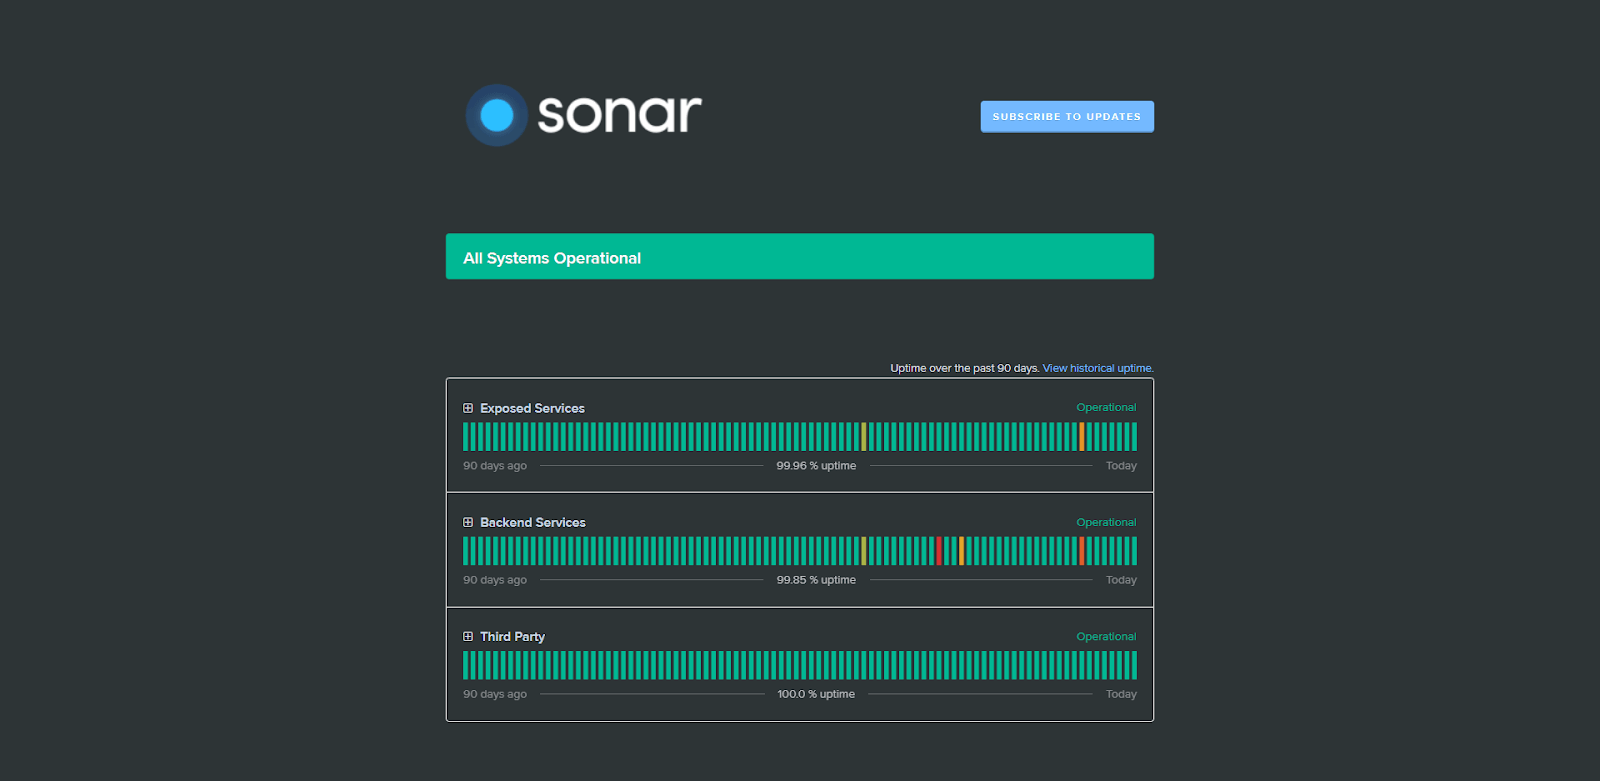
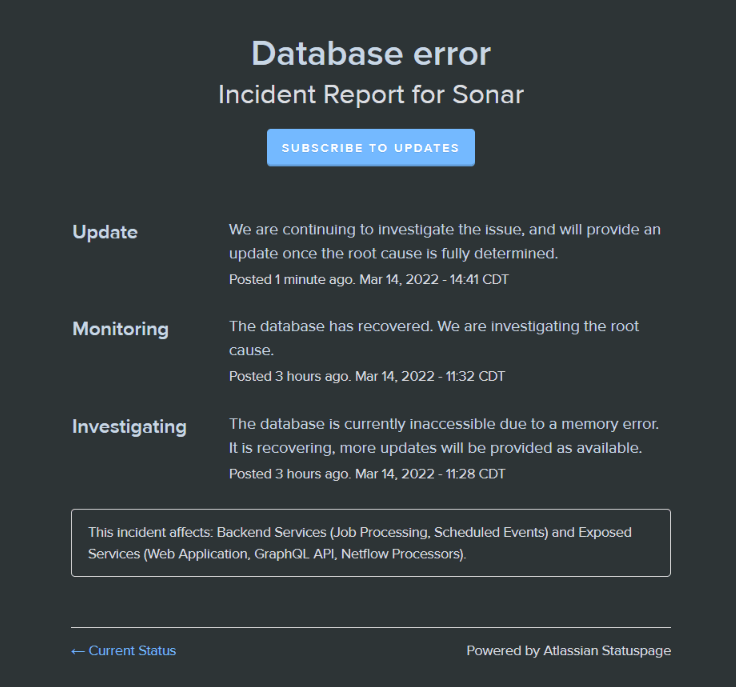
The status page is accessible via status.sonar.software and upon loading, you'll immediately be able to gather whether a problem is present or not by the banner displayed at the top of the page. If all is well, a green banner is displayed with the message "All Systems Operational". However, if an issue is active, you will instead see "Database error", with specific details regarding the error directly below.
In the event of an ongoing incident, you're able to expand the details by clicking on the name in the banner. Following this, a new page will populate that will include all details for that specific incident, including what branches of the Sonar Software it'll affect.
Subscribe to Status Updates by Email, Text, Slack, or Webhook
While the status page is helpful, the ability to subscribe to updates takes this one step further. With a simple click of the "Subscribe To Updates" blue button, you're able to select how you want to be informed, from email updates, text alerts, Slack messages, or even webhook notifications. Each option details what sort of updates are relayed via that method, for example: email notifications include information about new incidents, their updates and as they're resolved, whereas text messages solely include details when a new incident arises and when it's handled. Once you've selected the method you wish to use, you need only fill in the necessary fields and you're set. And of course, in the event you no longer want to subscribe to updates, it's easy to opt out too.
90-Day Uptime by Service and Component
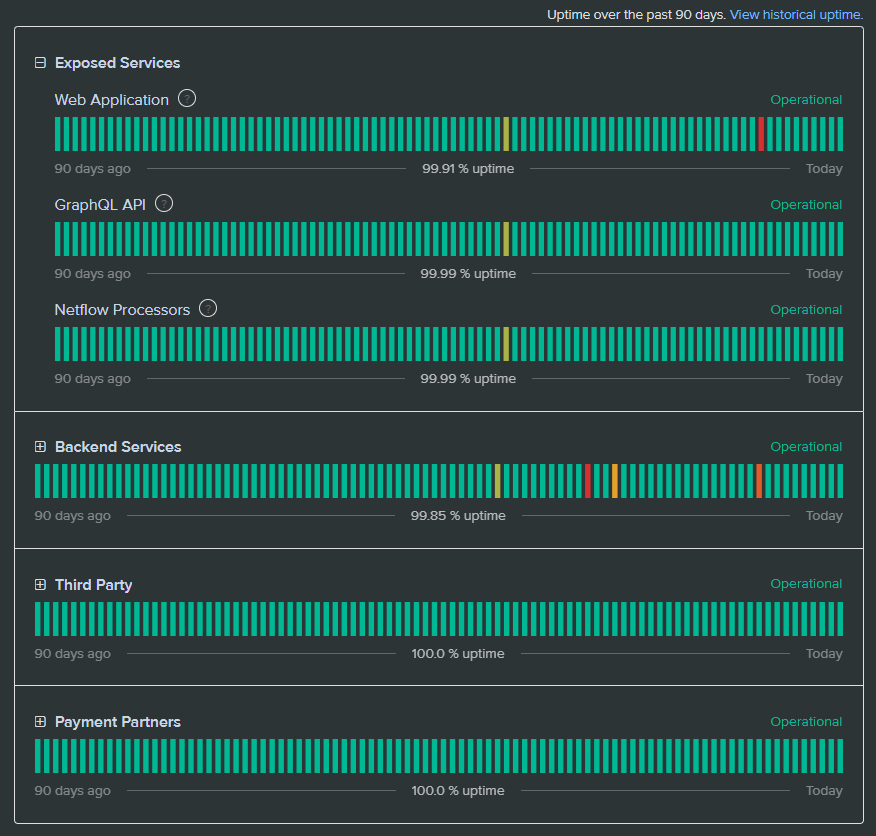
Continuing down the status page, you can see the cumulative uptime of each branch of the Sonar Software spanning over the past 90 days; and for an even further detailed breakdown, you're able to expand each service to see the individual components and their uptime.
Historical Uptime Beyond 90 Days
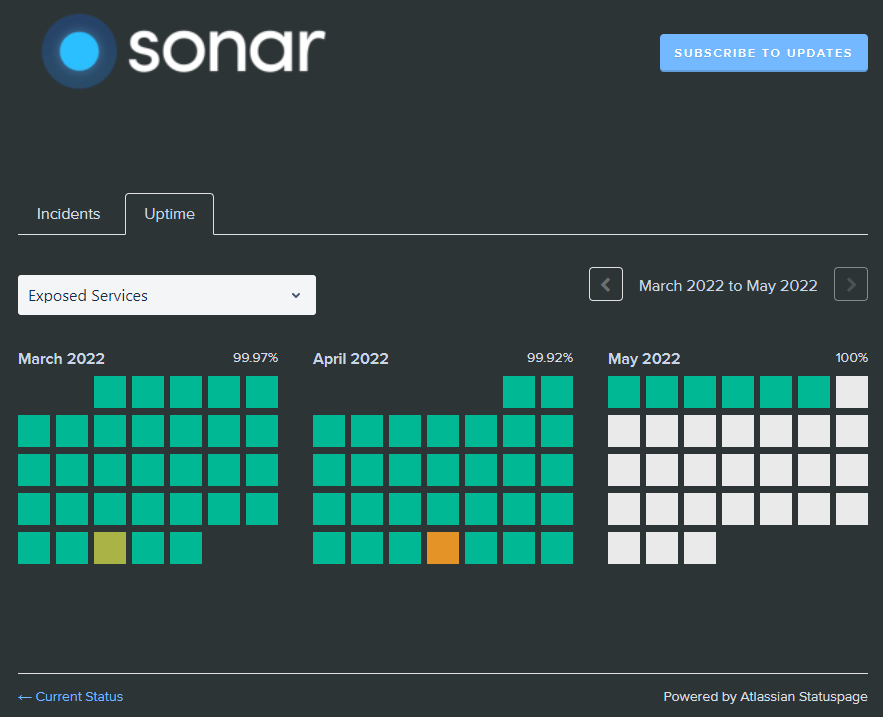
In the event that you're looking for historical uptime surpassing 90 days, you're able to find this by clicking on "View historical uptime". From the newly populated page, you're able to select the services you're looking for further information on, and move through the previous months. If an incident exists for that service, the otherwise green square will be replaced with an alternate color and hovering your cursor over that particular box will provide a message detailing how many components experienced an outage, as well as the severity of that outage.
System Metrics: HTTP and GraphQL API Response Time
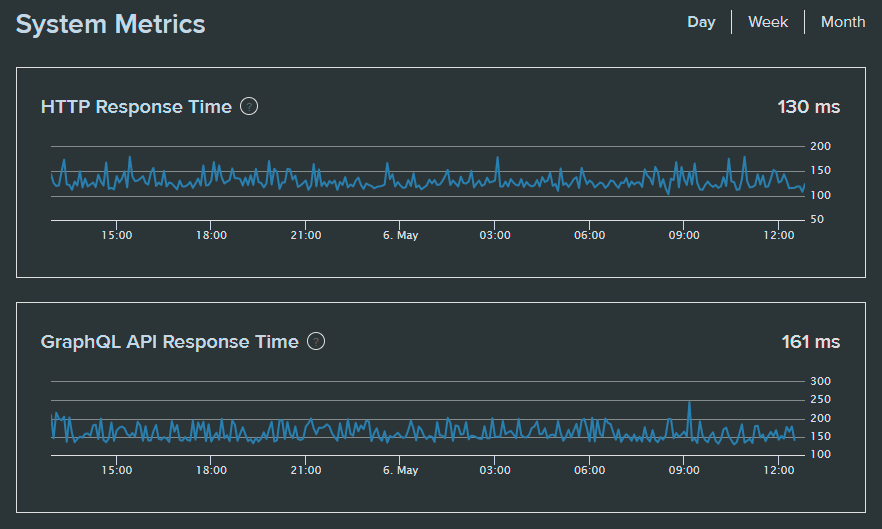
Bringing things back to the main status page, we also reflect the system metrics of the software, specifically the HTTP Response Time and the GraphQL API Response Time. The default time frame reflected spans over the past day, however, this can be toggled to "Week" or even "Month" if desired. Access to this information can be particularly beneficial if you're noticing a slowdown accessing the Sonar content and are in the process of determining whether the issue is local or not.
Past Incidents and Incident History
Finally, our status page includes historical information on past incidents. The list displayed includes the prior two weeks of dates, with each day detailing either "No incidents reported", or the full breakdown of any incidents experienced that day. Access to further data is available via the "Incident History" button at the very bottom of the page; this will populate a new page that allows you to transition between months, as well as whether you want to look at incidents or the uptime over that course of time.
Whether you subscribe to updates, or you just want to view the status page as needed, we hope this detailed the various information available at your fingertips. Should you have any questions or concerns, please contact us.
Frequently asked questions
Where can I find the Sonar status page?
The Sonar status page is available at status.sonar.software. The banner at the top shows "All Systems Operational" when everything is running, or a "Database error" message with details when an incident is active.
How do I get notified about Sonar incidents?
Click the "Subscribe To Updates" button and choose email, text, Slack, or webhook notifications. Email covers new incidents, their updates, and resolutions, while text alerts cover when an incident arises and when it's handled. You can opt out at any time.
How can I tell if a Sonar slowdown is on my end?
Check the System Metrics section on the status page, which shows HTTP Response Time and GraphQL API Response Time over the past day, week, or month. If those metrics look normal during a slowdown, the issue is likely local to your network rather than Sonar.
Questions, answered.
What is the Sonar status page and what does it show?
The Sonar status page at status.sonar.software shows real-time uptime, system metrics, and ongoing and past incidents in one place. A green All Systems Operational banner signals no issues, while an active incident shows a Database error banner with details below.
How do I subscribe to Sonar status updates?
You can subscribe to Sonar status updates by email, text, Slack, or webhook notifications. You can opt out at any time.
How can I check Sonar's uptime history?
The status page displays cumulative uptime for each Sonar service over the past 90 days. You can expand the view to see individual components.
How do I tell if a Sonar slowdown is on my end or Sonar's?
The status page reports system metrics including HTTP Response Time and GraphQL API Response Time. These metrics help ISPs determine whether a slowdown is local or not.
See it on the platform
20 minutes wired to your operation.
An ISP-only specialist walks Sonar through your specific use case. No generic deck, no horizontal SaaS pitch.
Book a meeting